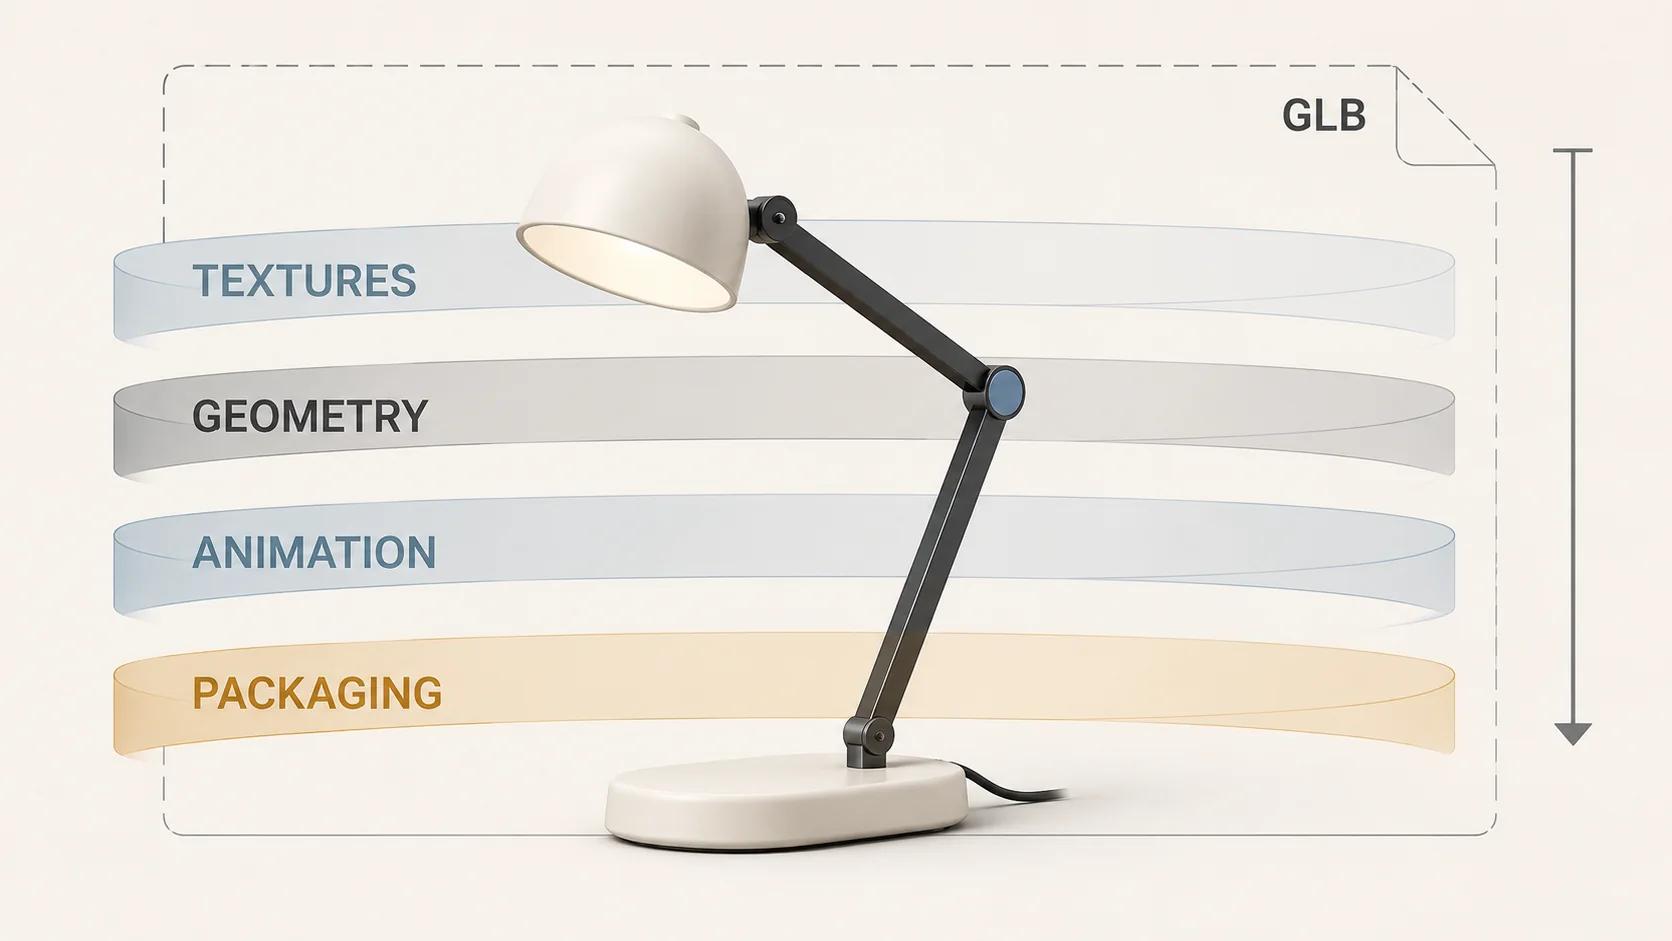
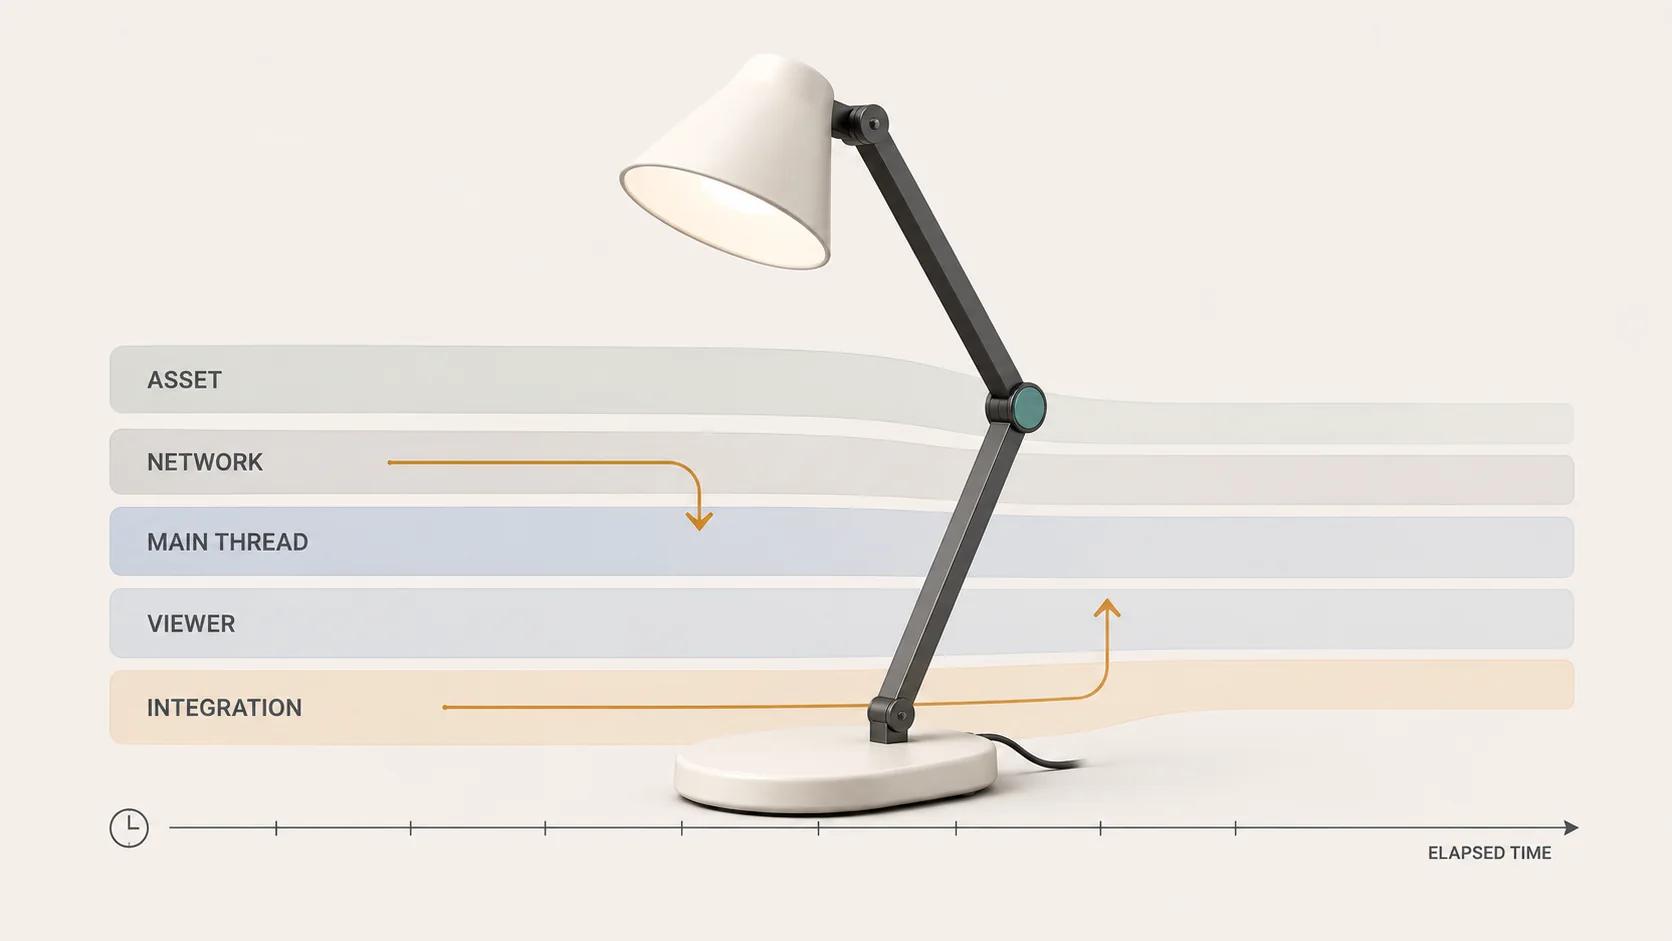
A slow 3D model on a website is a symptom, not a diagnosis. The delay may happen before the model request starts, while bytes cross the network, while the browser parses and prepares the scene, while the viewer draws each frame, or after page code initializes the same experience twice. Re-exporting the model before locating that delay can trade visual quality for no useful gain.
The quickest route to an answer is a controlled trace. Keep one release candidate, one page revision and one test profile fixed. Then identify where elapsed time accumulates. This guide covers that fault-isolation step. The web-ready 3D model optimization guide covers broader asset budgets and production choices, so this page does not repeat them.
Separate five kinds of slowness
Teams often use “the model is slow” for different failures:
- Start delay: the page looks ready, but no model request has begun.
- Transfer delay: the request has started, and the response is still arriving.
- preparation delay: the response has finished, but the first usable frame is late.
- interaction delay: the model appears, but orbit, zoom or a variant change stutters.
- lifecycle drag: the viewer keeps consuming work after it is hidden, removed or replaced.
Those symptoms point to different owners. Start delay is usually viewer policy or page integration. Transfer delay belongs to the asset-and-network path. Preparation delay may include decompression, parsing, texture work, shader compilation and competing JavaScript. Interaction delay needs a runtime trace rather than another page-load score. Lifecycle drag is an integration cleanup problem until evidence says otherwise.
Chrome DevTools can record both page-load and runtime profiles, apply CPU and network throttling, and expose main-thread, network and memory tracks.[1] Use a load trace for the route-to-first-frame path and a runtime trace for orbit, zoom, variant switching, page hiding and route changes. One overall score cannot tell you which layer owns the delay.
Freeze the test profile before changing anything
A comparison is useful only when the test conditions survive the fix. Record the following before the first run.
| Test field | Required record | Starter profile for this diagnostic | Acceptance rule |
|---|---|---|---|
| File | Exact release-candidate filename, byte size and checksum | candidate.glb is the protocol label; substitute the real filename and checksum before testing | The same bytes are used in every baseline and comparison run |
| Page | Exact URL, build or commit, viewer package and configuration | One release-like product page with one viewer instance | No code or content changes between baseline repetitions |
| Desktop | Browser build, operating system and DevTools settings | Current stable Chrome on Windows 11, 4× CPU slowdown | Five cold-cache runs complete without a setup deviation |
| Physical device | Device model, OS, browser build and power state | One in-scope mid-range Android phone on external power | Repeat the core interaction script five times on the named device |
| Network | Cache state, downlink, uplink, latency and connection path | Cold cache; 10 Mbps down, 1 Mbps up, 100 ms round-trip latency | All compared lab runs use the same profile; warm-cache runs are reported separately |
| User-visible endpoint | Start and finish events | Deliberate viewer activation to stable first frame with controls responding | Median of five runs at or below 5 seconds, with no run above 7 seconds |
The filename and thresholds above are an editorial starter protocol, not a measured result, platform limit or universal budget. Replace candidate.glb with the actual release asset. If the target audience uses another browser, device or network, change the profile before testing and retain both the old and new records. Do not move a threshold after seeing a failure.
Chrome's Network panel can preserve requests across navigations, disable cache for a first-visit test and apply a custom network profile.[2] CPU throttling is relative to the test computer rather than a literal emulation of a phone, so the physical-device pass remains necessary.[1]
Follow the asset-viewer-integration decision tree
Use this sequence on the fixed profile. Stop at the first branch with evidence; do not optimize every layer at once.
- Did the GLB request start within 250 ms of the intended trigger? Check the Network initiator and the trace timestamp. If not, inspect consent gates, lazy-load conditions, event handlers, route hydration and competing scripts. The acceptance threshold is one request beginning within 250 ms of deliberate activation on all five desktop runs.
- Did the exact expected response arrive once and finish inside the five-second endpoint? If the request redirects, repeats, fails, waits on an unexpected origin or transfers most of the elapsed time, keep the investigation in the network/asset branch. The acceptance threshold is one successful request, no redirect, no undeclared dependency failure and no duplicate full transfer.
- Did the response finish at least 500 ms before the stable first frame? If yes, transfer is not the whole problem. Inspect the main-thread flame chart, decoder work, parse activity, texture preparation, shader work and other page JavaScript. The acceptance threshold is no unexplained post-transfer gap above 500 ms in the median trace.
- Does interaction remain smooth after the first frame? Run the same ten-second orbit, zoom and reset script. If stutter appears only during movement, inspect per-frame rendering work and scene complexity. The starter gate is no model-related main-thread task over 50 ms during the scripted interaction and no control failure in five attempts.
- Does work stop when the viewer is no longer active? Hide the tab, move the viewer offscreen and navigate away in separate runtime traces. The gate is no continuing viewer frame loop while hidden, no second initialized viewer after returning, and memory returning to a stable plateau across three route cycles.
- Is the remaining failure an AR launch, scale, material or device-delivery problem? Leave this page's scope and use the interactive 3D product experience guide. A browser viewer pass is not an AR pass.
Read the network path without blaming file size
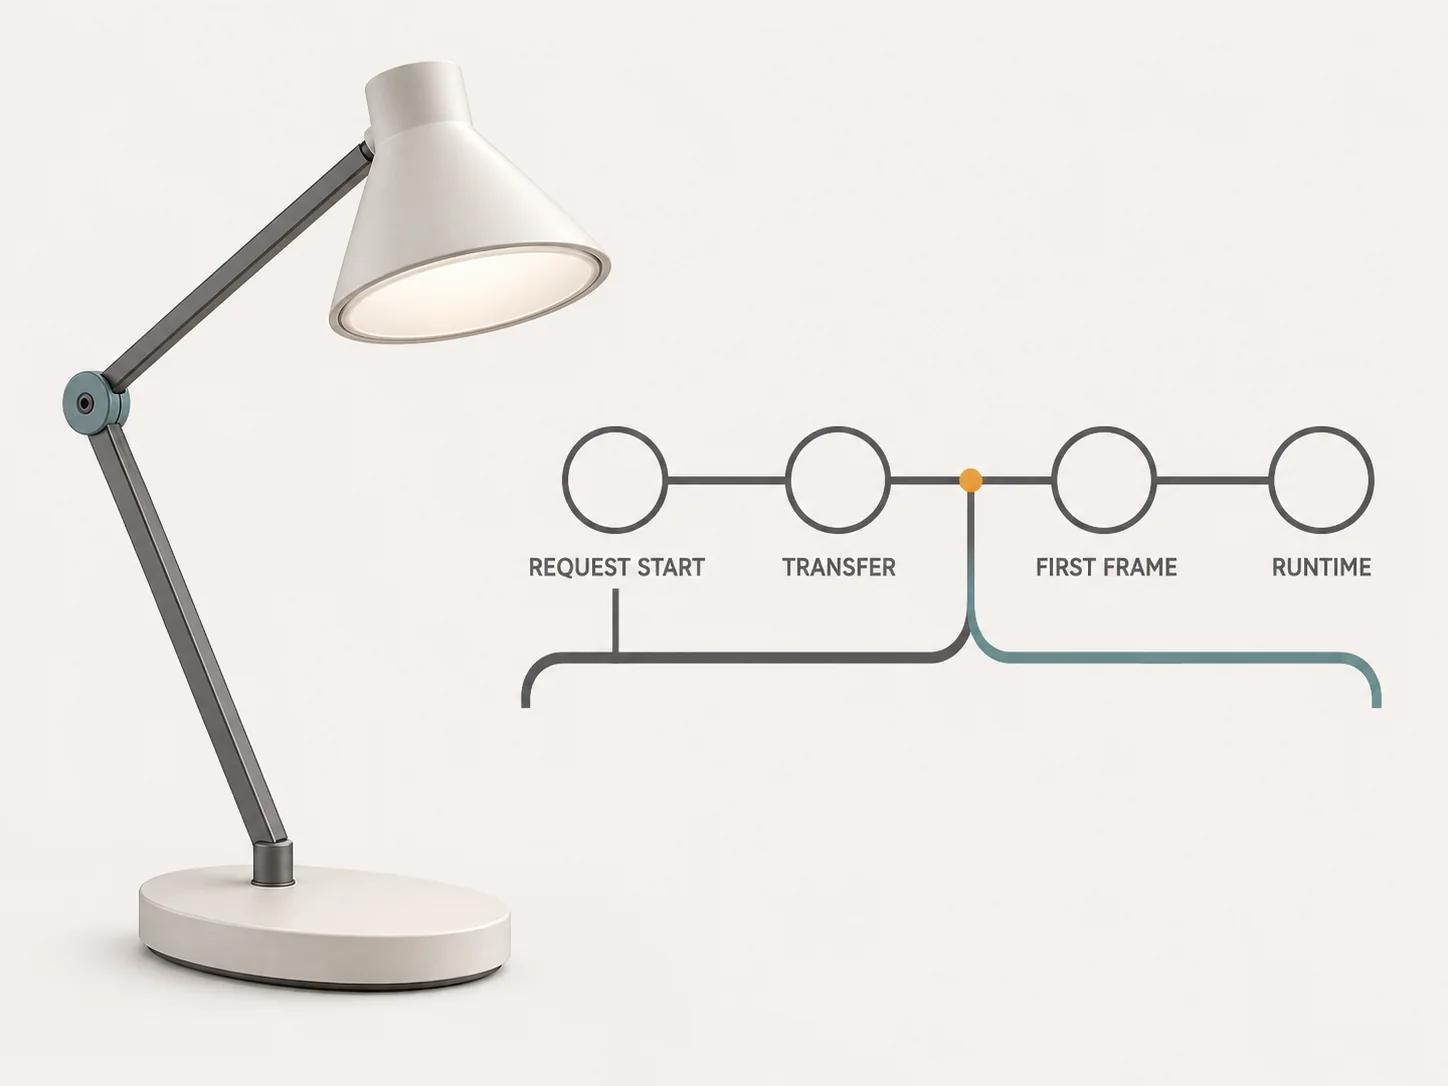
First locate the request. If it begins late, reducing bytes cannot fix the missing start signal. Inspect the request initiator, priority, redirects, DNS and connection setup, response wait, content download and any right-edge delay after the response. Chrome's Performance documentation distinguishes request waiting, content download and time spent waiting for the main thread; that last interval is easy to mistake for network delay.[1]
Use the baseline candidate.glb, current Chrome on Windows 11, the fixed cold-cache network profile and five runs. Accept the network branch only when one expected model response arrives with no redirect, no duplicate full transfer, the declared content length matches the recorded bytes, and all required resources return successfully. Then run one warm-cache comparison and record whether the model is reused or retransferred. Treat a cache miss as evidence to inspect headers and request identity, not proof that “the CDN is slow.”
For production instrumentation, the W3C Resource Timing specification defines PerformanceResourceTiming so applications can collect timing data for document resources.[4] Mark viewer activation, request start, response end and stable first frame with one naming convention. In this starter protocol, the acceptance threshold is a complete event chain in at least 95% of internal test sessions. The 95% figure is a Double Edged editorial recommendation, not a W3C requirement, measured result or speed claim.
If the transfer itself dominates and the exact GLB is too large for the agreed profile, move to the GLB file-size diagnostic and repair plan. Keep this article focused on locating the bottleneck rather than prescribing a universal megabyte target.
Inspect the post-transfer main-thread gap
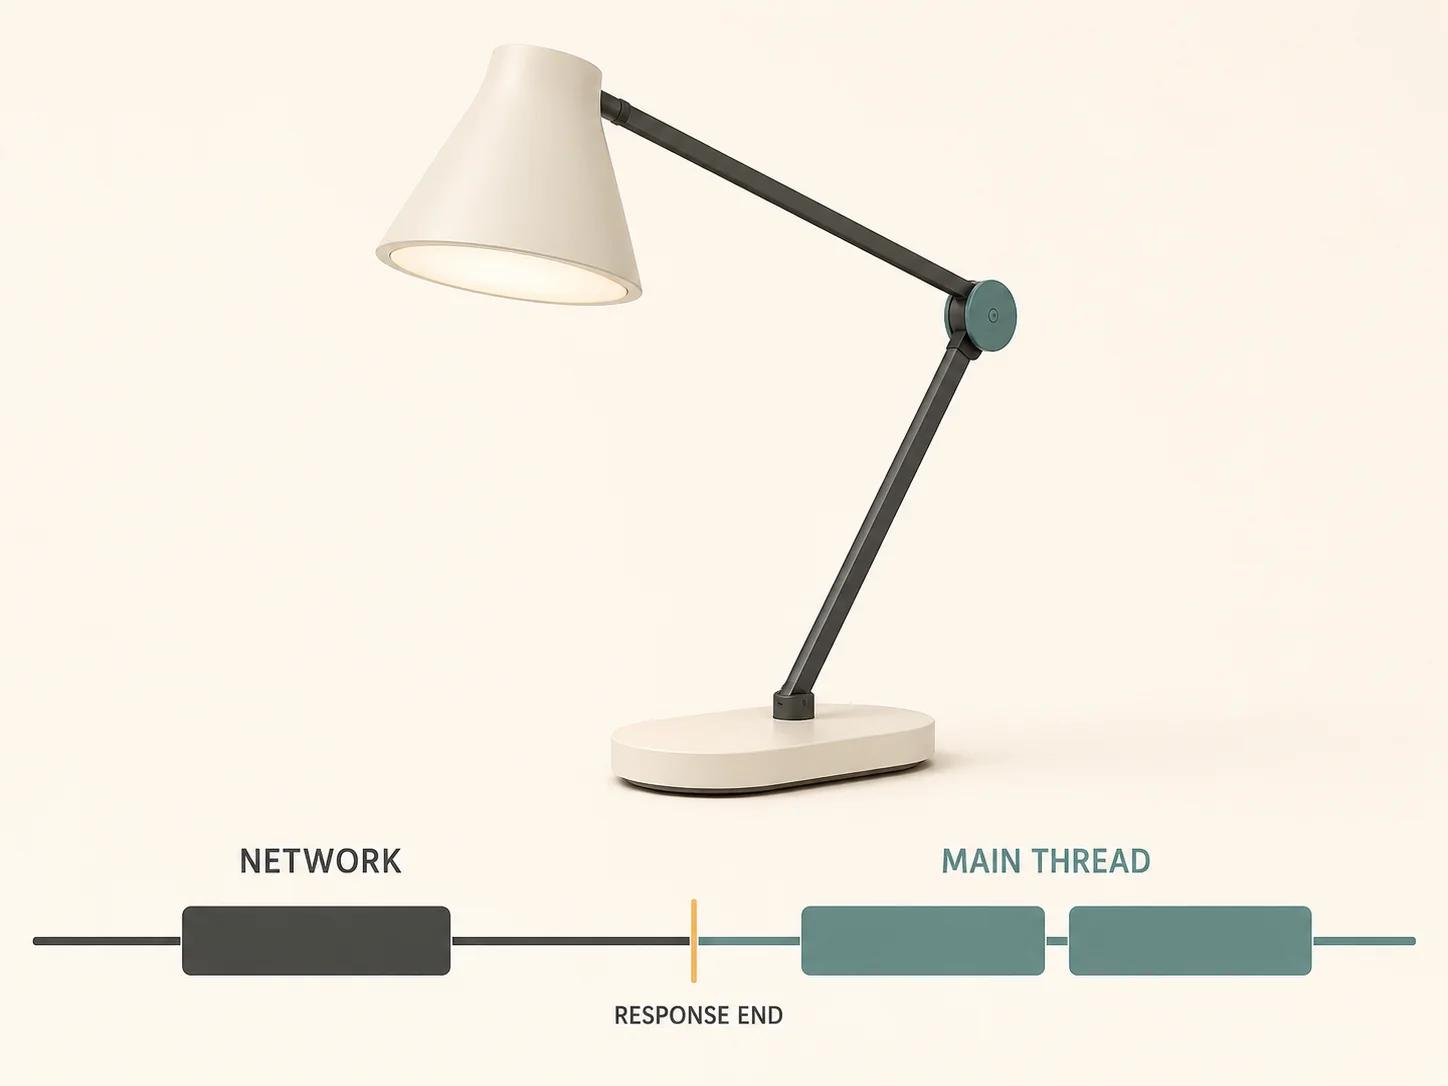
The browser's main thread processes one task at a time, and web.dev defines a task longer than 50 ms as a long task.[3] That makes 50 ms a useful diagnostic line, but it does not identify the responsible code by itself.
Record from deliberate activation through the stable first frame with candidate.glb, current desktop Chrome, 4× CPU slowdown and the fixed network profile. Select the gap between response end and first usable frame. Attribute wide tasks to model parsing, a decoder, viewer code, framework hydration, analytics or unrelated page work. The starter gate is zero unexplained model-path tasks above 50 ms and a median post-transfer gap at or below 500 ms. If a task belongs to an unrelated script, changing geometry will not remove it.
Repeat on the named Android device without pretending desktop CPU throttling duplicates its processor. Accept the change only if the five-run median improves on both profiles and the model still passes the approved visual review. A faster trace with damaged labels, silhouette or materials is a failed asset decision.
Test the viewer's loading and render policy
A viewer decides when to fetch, what poster to show, which decoders to load and whether rendering continues while idle. The official <model-viewer> loading examples document poster-based loading, an interaction-driven reveal pattern and on-demand auxiliary decoders for supported compressed assets.[5] Those features can save work, but each adds state that must appear in the trace.
On the baseline page, accept the viewer branch when the poster appears before activation, activation creates one model request, any required decoder is visible and cached as expected, progress resolves to one stable frame, and controls work five times on both named profiles. If product policy calls for eager loading instead, record that decision and move the request-start threshold to navigation; do not mix eager and interaction-driven runs in one median.
The glTF specification permits buffers and images to be separate resources, and even a Binary glTF asset can refer to external resources.[6] Inspect the actual dependency graph rather than assuming the .glb suffix proves a one-request payload. Khronos also offers a glTF Validator that runs locally in the browser.[8] Structural validation closes a file-conformance check; it does not prove page speed or visual acceptance.
Audit page integration and teardown
When the same asset is fast on an isolated viewer route but slow on the product page, compare the two traces instead of exporting again. Look for delayed custom-element registration, duplicate component mounts, variant handlers that reset the source, multiple observers, hidden canvases still drawing, and route transitions that retain a renderer.
Use the exact candidate.glb, current desktop Chrome, the fixed network profile and three complete route cycles: enter the page, activate the viewer, leave, then return. Accept the integration lifecycle when each cycle creates one active viewer, issues no duplicate full model transfer, removes obsolete listeners and observers, stops the old frame loop and reaches a stable memory plateau. The test should also pass on the named Android device for five activate-hide-return attempts.
The document visibilitychange event reports when a page becomes hidden, and MDN identifies that transition as a suitable point to stop UI updates and unwanted background tasks.[7] Use it as one lifecycle signal, alongside component teardown and offscreen policy. The gate is observable inactivity while hidden, not the mere presence of an event listener.
Keep one acceptance record per change
A fix should name its layer and preserve the evidence that ruled out the others.
| Candidate change | Fixed test inputs | Evidence to compare | Starter acceptance threshold | What it cannot prove |
|---|---|---|---|---|
| Change model delivery | Exact GLB checksum; page build; desktop Chrome; named Android device; cold 10/1 Mbps, 100 ms profile | Waterfall, response bytes, dependency list, first-frame mark | One model response; no redirect or failed dependency; median activation-to-frame ≤5 s | Runtime smoothness or AR delivery |
| Change decode or parse path | Same GLB and page; desktop at 4× CPU; named Android device; fixed network | Post-transfer trace and long-task attribution | Median post-transfer gap ≤500 ms; zero unexplained model-path tasks >50 ms | Visual parity after lossy asset work |
| Change viewer policy | Same file, page and devices; cold and warm cache recorded separately | Trigger, poster, decoder and model request sequence | One intended request per activation; five of five control runs pass | Page teardown or another viewer library |
| Change page integration | Same file, build, devices and network; three route cycles | Mount count, request count, frame activity and memory trend | One active viewer; no old loop while hidden; stable memory plateau | Asset quality or destination compatibility |
Keep raw traces, HAR files, checksums, screenshots of approved product details and the exact test script. Report medians with individual runs rather than keeping only the fastest attempt. Reopen the affected rows when the model, viewer, framework, hosting path, browser or target device changes.
Use the private checker for the GLB gate only
The Private GLB Readiness Checker inspects and previews a selected self-contained GLB locally in the browser, and the selected GLB remains local. It reports four separate destinations: Online store, Shopify, Product customizer and Android AR. Browser preview does not prove destination compatibility or performance.
Use its inspection as asset evidence alongside the page trace. The optional editable Excel QA workbook is a secondary resource for teams that need to hand owners and findings between departments. It does not replace the live page, physical-device or integration tests in this workflow.
Hand off the layer you actually found
A useful escalation package contains the authorized public page or release-like test route, exact asset checksum, viewer and framework versions, named devices, network profile, five raw runs, the first failed decision-tree gate and the acceptance threshold. That is enough to distinguish asset repair from viewer or integration work without claiming certainty from a screenshot.
If the evidence points to production changes, use the web-ready and AR-ready 3D service after the failed layer and required product details are clear. Diagnose the problem first, then use the service page when the next step is production help.